
Being able to effectively communicate your testing status is important for a lot of testers. I’ve seen several queries on this topic lately, specifically, inquiring about how to report on said status. In today’s post we will explore various examples on how to communicate your testing status, complete with downloadable templates!
To start, there’s a pretty distinct difference on how to report status if you’re executing actual test cases vs. some other form of testing. I feel like it’s distinct enough that I’d like to break them out into two sections: Reporting status based on test case execution AND Reporting status without test case execution.
Lastly, this post mostly speaks to those who aren’t able to utilize a test management tool to pull reporting from. If you do have a test management tool, I’d urge you to check out their reports so you aren’t reinventing the wheel and wasting precious time.
Reporting Status Based on Test Case Execution
There are a few levels of detail to choose from when it comes to communicating status. Based on your organizational needs, I will outline both a Summary and Detailed view for you. In addition, I’ve included some example graphs if you’d like to add that visual to your status update as well.
Summary
In this style the tester is essentially giving a bare bones status update. The main take-aways are a high level communication outlining how many test cases you’ve executed and how many are remaining. Included are also pass and fail metrics.
Note that I’ve included an automation section as well. The intention here is to give one big picture of your total cycle status. The automation statistics could very well be lifted from reporting via your automation tool. If you don’t have automation, simply remove the section. Here is a screen capture, but feel free to download the full excel template.

Detailed
In this style, the tester is giving quite a bit more information. Along with the summary section, you can also break down your testing further and give the above metrics at the component or feature level. In addition, this report outlines the details on each of the defects logged.

Detailed – With Graphs
I’ve included some graphs in this version. The data sheet has some pivot tables built out so you can easily add your data to the sheet and it should pull into the graphs with ease.

Reporting Status Without Test Case Execution
Many people, outside of the QA role, lean on metrics to help them understand what’s being tested and how much progress you’ve made. Percentage complete and pass rate are some of the most common QA metrics used, and having test cases to calculate these metrics is the most common way to report them.
If you’re not writing and executing test cases, trying to report on your testing progress might seem like a challenge. With test cases, it’s easy to spell out that you have X number of test cases in total, and you’ve executed Y, so you’re Z% completed. The good news is, those metrics aren’t the only way for you to communicate your status to your team or manager. And quite frankly, they aren’t even the most informational. Let’s explore a few other options. Feel free to mix and match and get creative on your own. Knowing your audience and what they will find most valuable is key to overcoming this hurdle.
- You can use your test scenarios to count instead. You’re still saving time by not writing out steps for every scenario, and you also have a count of something to be able to report on. This is probably the closest to what your manager is used to today and could be a quick baby step for you to take without disrupting too much of what your manager is comfortable with.
- If you’re using a feature map, you can report on the total number of pages / how many you’ve tested through. Similar to a % complete of test cases or test scenarios, this gives your manager a familiar understanding of where you are in your testing.
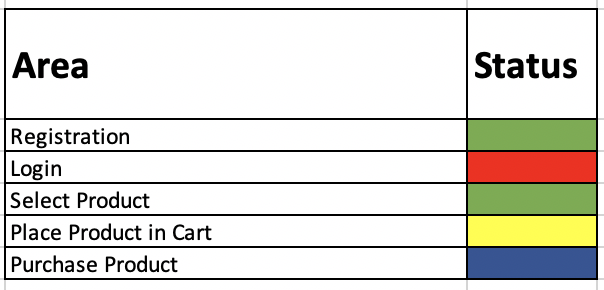
- If your management team is keen on visuals, try taking your feature map and adding a color-coded system to represent status. For example, if the row is green, it’s been tested and has passed. If blue, testing is in progress but no issues have been found. If yellow, minor issues were found. If red, major issues were found. This could give a quick indicator of your testing and any areas that are at risk.
- If you totally want to get away from % completed, passed, and failed – which I believe isn’t the most valuable information we could be giving any way – use a bulleted list (managers love bulleted lists) to outline the highlights. This could be useful for exploratory testing. For example, at the end of the week, or test cycle, you could send out:
- Defects Reported: List the defects your team has found and the current state of each defect (fixed, in dev, backlogged, etc…). You could even add metrics around this to show the severity of the bugs you’re finding and how quickly they’re being fixed.
- Blockers: List any blockers you have to finish testing. Think about test data issues, unexpected sick leave, third-party integrations that aren’t available, etc… This fosters collaboration and allows your test manager to jump in and help resolve blockers with you.
- Areas Tested: List areas of the application you’ve tackled so far. You can use your feature map to help tell the story as well. If you’re not using feature mapping, try using areas of the application instead.
- Areas Remaining: List areas of the application you have left to test. You can use your feature map to help tell the story here as well. If you’re not using feature mapping, try using areas of the application instead. Think about what areas are most risky and perhaps you can indicate risk levels in this section.
- Automation Completed: If your team has automation in place, don’t forget to report on the progress. This is where you could use some % completed because automation executes test cases. So giving transparency into this metric will feel familiar to your management team.
This bulleted output gives your team and leaders insight into what you’re working on and how it’s going – it’ a conversation starter. Just providing % completed and a pass rate doesn’t effectively tell the full story. For example:
- Defects Reported:
- DE13534: Cannot log into site from IE – High priority – In Dev
- DE14324: When clicking Next, the site crashes – High Priority – In Dev
- DE14533: Here is misspelled hear on the terms and conditions page – Low Priority – Unplanned
- Blockers:
- No reported blockers at this time
- Areas Tested:
- Registration – Passed
- Depositing money into account – Passed
- Login – DE13534
- Areas Remaining:
- Select product – Not started
- Place product in cart – In Progress
- Automation Completed: 74% of automation completed with a 82% pass rate
Conclusion
As you’ve read today, communicating your status to others is a unique thing for each tester. Finding the right combination of metrics that are useful to your team is a major contributor to communicating effectively. My goal with this post was to walk you through multiple ways of communicating your testing status. Feel free to pick and choose and create your own template.
Community, did I miss any discussion points you think are important to a status report? If so, give me some feedback in the comments below!
